Drinkware collectors have been around for a long time, and for the average consumer, this behavior is usually rooted in utility. According to established studies, the average American owns 4 reusable water bottles – a rotation for the gym, the commute, and the office. However, while analyzing drinkware threads on forums like Reddit, we noticed a shift in the Stanley customer base. It is no longer uncommon to spot users claiming to own over 100 items, suggesting a behavior that transcends simple hydration.
Intrigued by the sheer volume of these claims, we dug deeper, utilizing data from the inventory tracking app Cupboard, a platform exclusively for drinkware enthusiasts. By analyzing the portfolios of over 10,000 Stanley owners, we have defined a new consumer demographic: the Super Collector. This report moves beyond sentiment to define this group by hard data, exploring the financial, spatial, and environmental realities of treating water bottles as an asset class.
Key Insights:
- For every two people who start tracking their Stanley collection, one will eventually cross the 10-bottle threshold.
- Entering the top 5% of Stanley collectors requires owning 90 bottles, an entry cost of $3,496.
- The average “Super Collector” (158 bottles) holds a portfolio worth $6,155 – comparable to a Rolex Oyster Perpetual 36.
- Holding a collection of 158 bottles for 20 years rather than investing in the S&P 500 results in a “Sentiment Tax” of over $35,000.
- A collection of 158 Stanley Quenchers (40 oz) generates the same carbon emissions as consuming 7,457 single-use plastic bottles.
Table of Contents
Part 1: From Casual Use to Extreme Accumulation
Part 2: The High Cost of Hydration
Part 3: The Economics of Resale
Part 4: The Physical Burden of Storage
Part 1: From Casual Use to Extreme Accumulation
Before defining the upper echelon of collectors, it is crucial to understand the speed at which this segment is expanding. Between April 1, 2025, and January 21, 2026 (a period of 296 days) the Cupboard app recorded the creation of 10,413 new Stanley collector accounts. This indicates an average onboarding rate of approximately 35 new collectors per day.
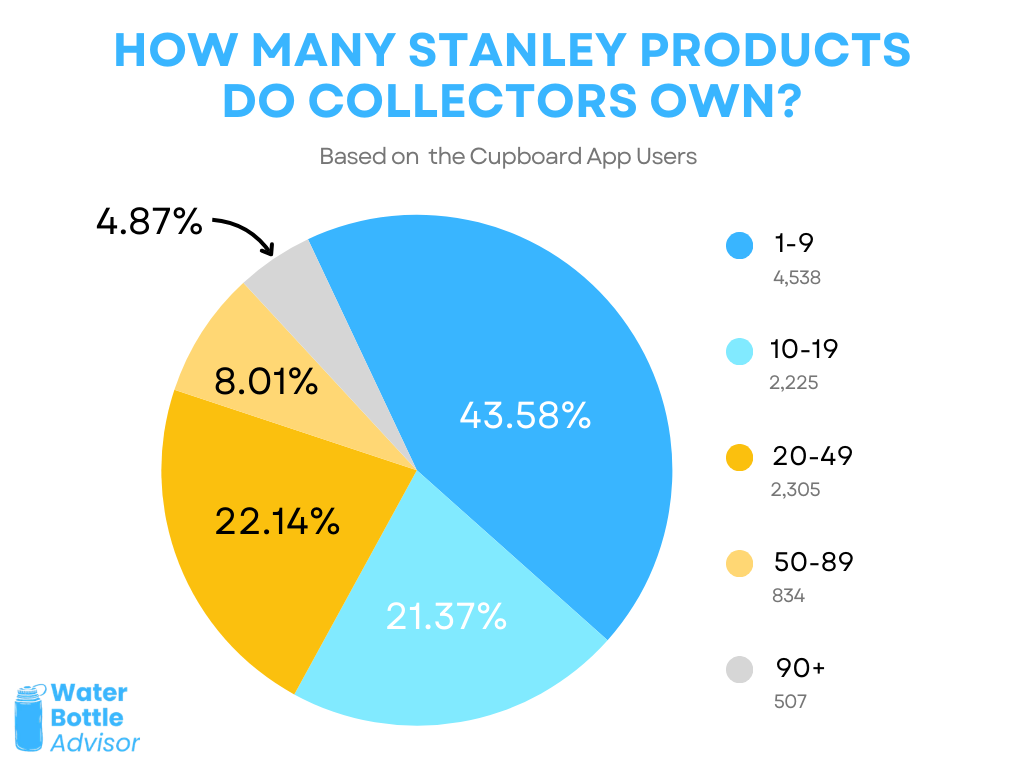
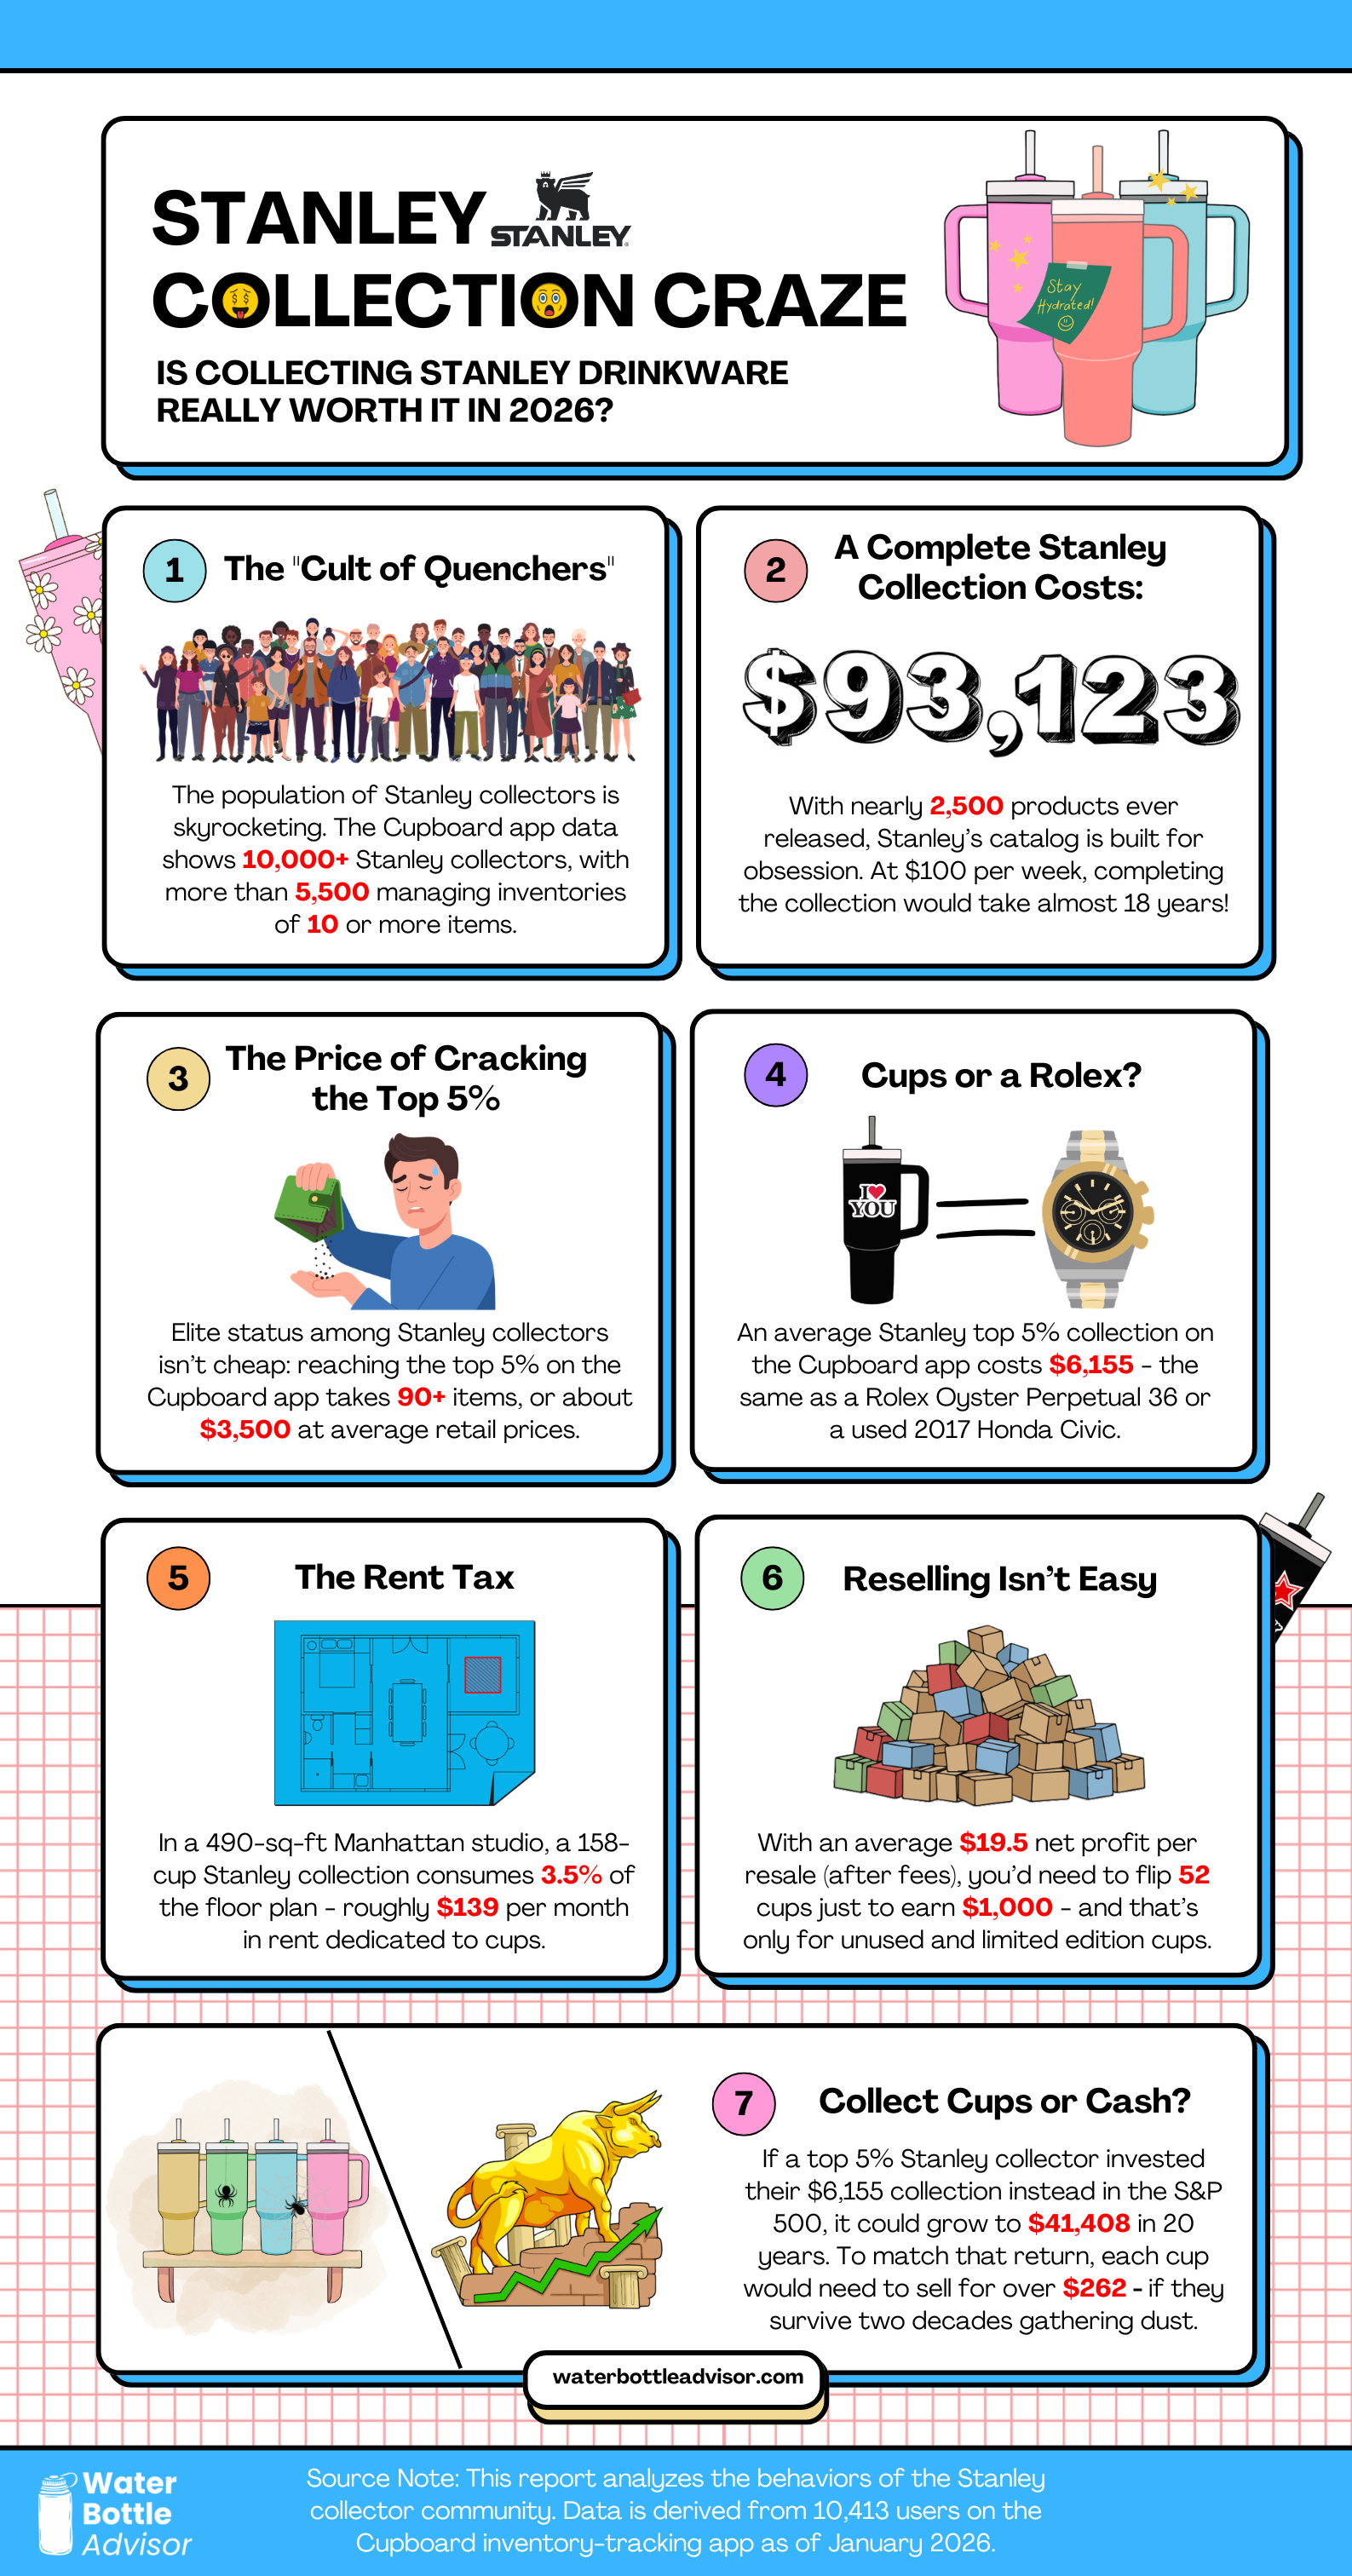
However, the data reveals that this is not just passive accumulation. Engagement levels are notably high. Of the 10,413 users analyzed, 5,538 collectors (≈53%) own 10 or more Stanley items. This suggests a rapid conversion pipeline: more than half of the users tracked progress quickly beyond “casual ownership” (1-9 items) into enthusiast territory. This data confirms that Stanley collecting is less a short-term trend and more a sustained accumulation behavior.
The “Super Collector” Threshold
While 10 items make you an enthusiast, the title of “Super Collector” is far more exclusive. To define where casual collecting ends and where Super Collectors are born, we set the threshold at the top 5% of the Stanley collector community, based on the Cupboard app’s Global Leaderboard.
The data reveals that the average collector in this top 5% tier holds 158 bottles and the inventory required to enter this elite circle is 90 bottles, with an estimated cost of $3,496.
Currently, approximately 500 users have reached that threshold on the Cupboard app. However, this figure represents only the “tip of the iceberg”. Given the thousands of untracked collections showcased on platforms like Reddit and TikTok, the total population of global Super Collectors is undoubtedly far larger.
Even within our tracked dataset, the pipeline is full: nearly 1,000 users are currently sitting between 50-89 bottles, putting them within striking distance of the Super Collector tier.
While the largest segment of users are casual owners, the behavior at the top of the curve is unusually aggressive. Among Stanley owners who actively track their collections, roughly 1 in 20 owns 90 or more items. For context, only 1 in 63 users of the competitor brand Owala owns 90+ items.
Verification of the “Super” Tier
To verify the behavior captured by the Cupboard app, we performed a manual audit of top-tier users. We reached out to five Super Collectors, all of whom confirmed their recorded collection sizes.
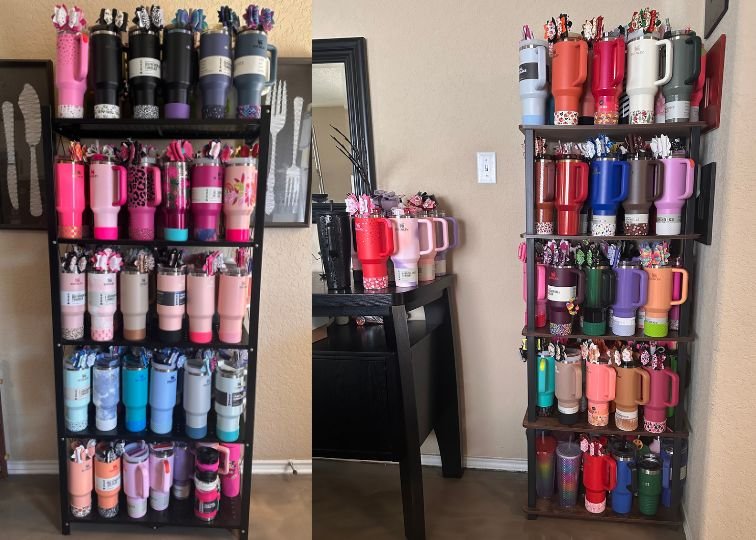
One collector, who owns 155 Stanley Quencher tumblers, provided photographic proof of their inventory. The collection currently occupies two full-height shelves; however, the owner noted that a third shelving unit is already required as the collection continues to expand. This confirms that for the elite 5%, the primary constraint on growth is no longer capital, but physical square footage.
Part 2: The High Cost of Hydration
It is difficult to visualize just how much capital is sitting in the kitchen cupboards of these super collectors until we compare it against real-world benchmarks. The average Top 5% collection carries a value of $6,155. To put that in perspective, this kitchenware collection is equal in value to a Rolex Oyster Perpetual 36 or a used 2017 Honda Civic.
The scale of this economy becomes even more staggering when we look at the aggregate data. The Top 500 Stanley collectors on the Cupboard app collectively own 79,222 bottles. It can be stated that just 500 super collectors own as many bottles as 19,805 regular buyers.
If we were to visualize this volume physically, assuming the collection consisted only of 40 oz Stanley Quencher tumblers (~12 inches tall), stacking the Top 500’s combined collection of 79,222 bottles end-to-end would reach a height of 79,222 feet. That is 2.7 times the height of Mount Everest (29,032 ft).
The Completion Cost
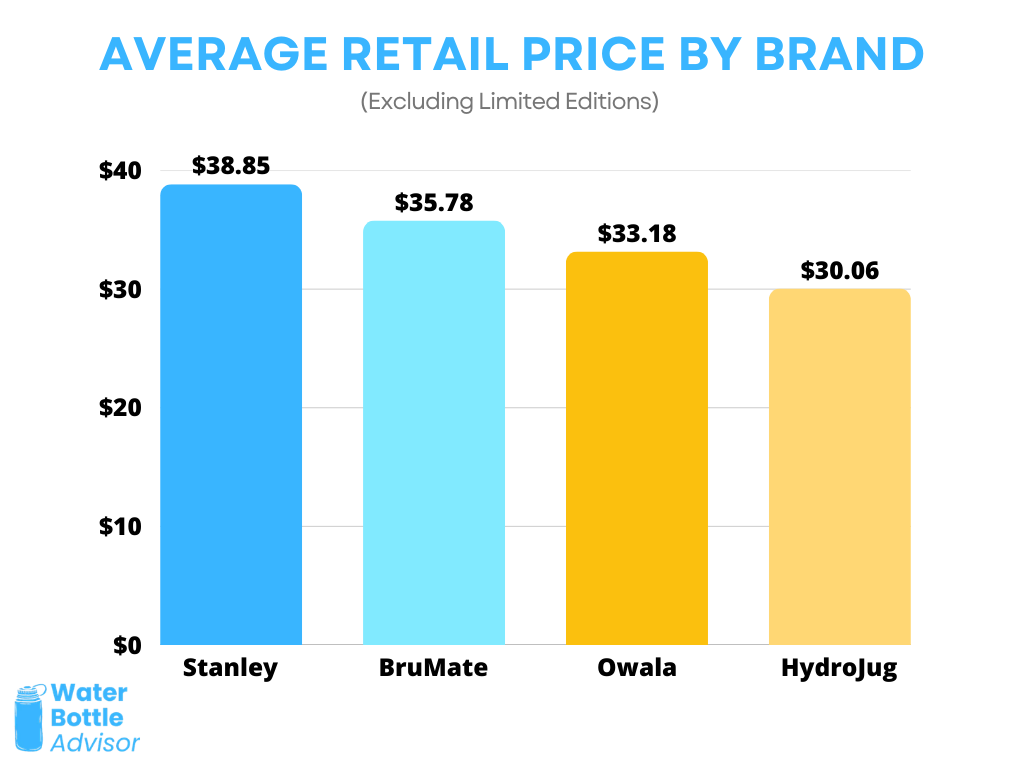
Many collectors aspire to go beyond the Top 5% – they aim for “completion”. To estimate the cost of owning the full Stanley catalog, we analyzed the average retail price of standard products across the “Big Four” collecting brands. Stanley commands the highest premium at $38.85 per item, compared to BruMate, Owala, and HydroJug.
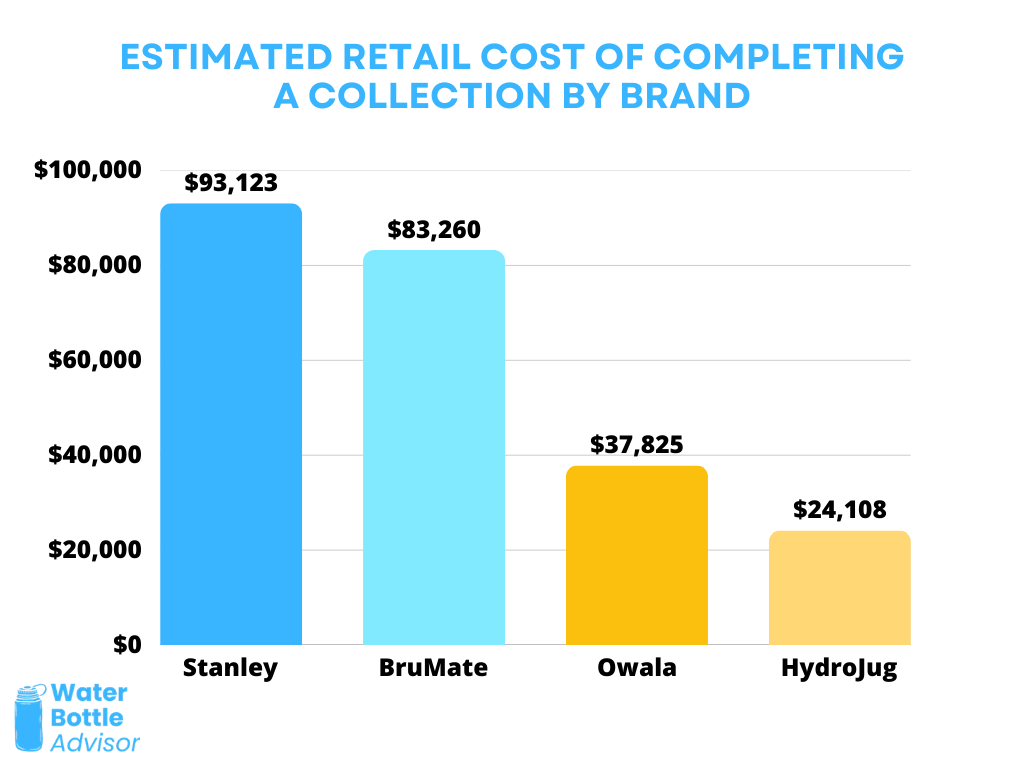
While the individual price difference is modest, the cost driver is volume. Stanley releases thousands of SKUs, and completing the full Stanley catalog (2,397 items) now costs roughly $93,123. By comparison, completing an Owala collection costs $37,825, and HydroJug just $24,108.
Even if a collector spent $100 per week, completing the Stanley collection would take nearly 18 years.
In real-world terms, the “Completion Cost” of a Stanley collection is equivalent to the price of a base-model 2023 Porsche Panamera, a full year of tuition, room, and board at Harvard University, or a 20% down payment on a $465,000 home.
Even limiting the scope to the popular “Quencher” tumblers still leaves a collector chasing 1,082 units in various colors and sizes.
Part 3: The Economics of Resale
We analyzed popular marketplaces to determine if collecting Stanley drinkware is a viable financial strategy. Based on nearly 2,000 product listings on eBay between November 2025 and January 2026, 69% of limited-edition Quenchers sold above retail, showing strong secondary market demand.
Despite the hype, long-term appreciation is not guaranteed. We analyzed five limited-edition collaborations released one year ago or earlier (approx. 800 listings on eBay). Of the group (Stanley x Lainey Wilson, Stanley x Olivia Rodrigo, Stanley x Tyla Tyger, Stanley x Barbie, and Starbucks x Stanley 2025) only the Lainey Wilson collaboration currently sells above MSRP. The other four trade below MSRP more frequently than they turn a profit.
For the items that do flip, the average profit is $22.57. After deducting eBay fees (13.6%), the net profit is $19.51 per item. When broken down into labor (15 minutes per item for listing and packing), the implied hourly rate is a respectable $78.04. However, this rate ignores the risk of unsold inventory and capital tied up in stock.
The true cost of collecting, however, is the Opportunity Cost. We modeled a 20-year outlook for the Stanley Top 5% collector holding a $6,155 portfolio. If they liquidated today and invested that capital into a standard S&P 500 index fund (10% historic average return), the portfolio would grow to $41,408 by 2046.
If they keep the cups, achieving that same value would require every single water bottle to trade for $262.08 in the year 2046. Unless one believes in that appreciation, holding the collection is mathematically irrational. The super collector is effectively paying a $35,253 “Sentiment Tax” just to look at cups on a shelf.
Part 4: The Physical Burden of Storage
It is easy to forget that stainless steel collections take up physical space. With urban living spaces shrinking, hoarding water bottles effectively levies a “Rent Tax” on the collector’s home.
Due to the wide 3.93-inch top diameter of the 40 oz tumbler, the average Top 5% collection (158 units) occupies a footprint of 17 square feet – roughly the size of a standard 3-seater sofa. Applying the “Manhattan Studio Index” (Jan 2026 data: 490 sq ft studio / $4,025 rent), this collection consumes 3.5% of the entire habitable floor plan. In Manhattan terms ($8.21/sq ft), the collector pays $139 per month in rent simply to house their bottles.
In terms of practical storage, a standard kitchen cabinet can hold a maximum of 21 Quenchers. Therefore, an average Top 5% collection of 158 bottles requires 2.5 full-size kitchen cabinets (top to bottom). If displayed in a library format using standard 30″ IKEA BILLY bookcases, the collector needs 4 entire bookcases dedicated solely to hydration vessels, assuming each bottle is displayed single-file for full visibility.
The burden is also one of weight and maintenance. The 158-bottle stash weighs 221 lbs (100 kg) – equivalent to an NFL Running Back sitting on the shelf. Furthermore, to clean these vessels, one must waste significant resources. A single rinse of the full collection consumes 158 gallons of potable water, enough to fill three standard bathtubs to the brim.
Eventually, collectors hit a “saturation point”. We spoke to a mid-tier collector on the Cupboard app (40 items) who admitted:
Despite not even cracking the top 10% of the leaderboard, her asset class had become a physical burden.

Part 5: The Sustainability Paradox
The central irony of the reusable vessel movement is the massive, hidden carbon cost of manufacturing heavy-duty stainless steel. While marketing promises environmental salvation, the physical reality of the 40 oz Quencher tells a different story.
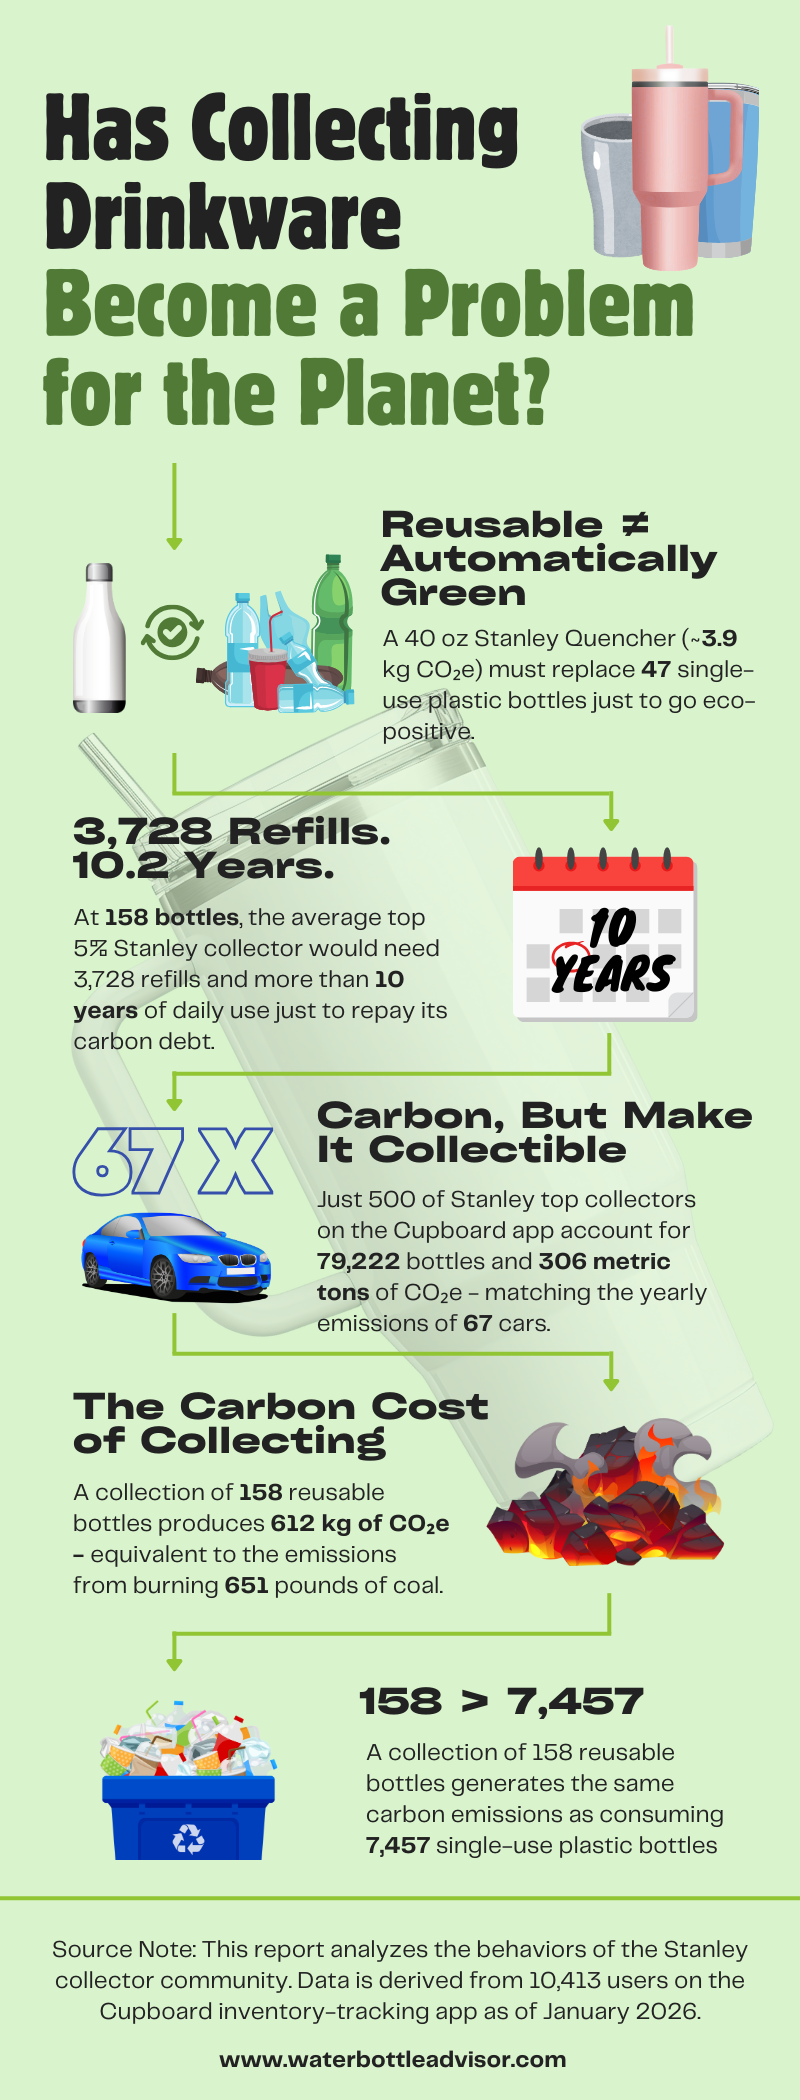
Producing a single vacuum-insulated 40 oz Quencher generates approximately 3.87 kg of CO2e (based on a product mass of 0.63 kg). To be “eco-positive” – saving more carbon than was emitted during its industrial production – a single bottle must displace at least 47 single-use 500 ml plastic bottles. This logic holds for the owner of one cup, but it mathematically collapses for the Super Collector.
The Footprint of Accumulation
The manufacturing of the average Stanley Super Collector’s personal stash (158 units) generates a staggering 612 kg of CO2e. This is the carbon equivalent of:
- Driving a gasoline-powered car ~1,500 miles (e.g., NYC to Miami).
- Burning 651 pounds of coal.
When we aggregate the Top 500 Stanley collectors on the Cupboard app, they are responsible for 306 metric tons of CO2e – effectively idling 67 passenger vehicles inside their homes for an entire year.
The Debt That Can’t Be Paid
Perhaps most shockingly, owning a “sustainable” collection of 158 Quenchers generates the same emissions as consuming 7,457 single-use plastic bottles.
To put that in perspective: a consumer could use 20 plastic bottles every single day for an entire year, throw every one of them into a landfill, and still have a lower carbon footprint than a single Super Collector who bought 158 “eco-friendly” cups.
To “pay back” this environmental debt, a Super Collector must use their collection to displace those 7,457 single-use plastic bottles.
Even if the collector is diligent – drinking one full 40 oz Quencher every single day (the volume equivalent of two standard 500ml plastic bottles) – it would take 10.2 years of exclusive, daily use just to reach the carbon-neutral “break-even” point.
Because these collections are often treated as decor or kept “New in Box” for resale, the carbon debt for the average Super Collector is effectively permanent.
Conclusion: The Diderot Effect
Why has a tool for hydration transformed into a high-stakes asset class? Psychologists point to the Diderot Effect – a phenomenon where the acquisition of a new possession triggers a spiral of further consumption to maintain a cohesive identity. In this ecosystem, the 40 oz Quencher is no longer a vessel; it is a tile in a never-ending mosaic of personal branding.
The data reveals a stark departure from the product’s original intent. When a kitchen cupboard houses 221 lbs of stainless steel and a collection stands as tall as the Statue of Liberty, the logic of “reusability” collapses.
Methodology & Data Integrity
I. Data Acquisition & Onboarding Velocity
- Sample Population: Primary data was sourced from the Cupboard app, a specialized platform for drinkware inventory management. The dataset includes 10,413 users who registered at least one Stanley product between April 1, 2025, and January 21, 2026.
- Onboarding Rate: Calculated by dividing total new Stanley-specific accounts (10,413) by the study period (296 days), resulting in a growth rate of 35.18 new users per day.
- Enthusiast Conversion: The “Enthusiast” tier (53%) was identified by filtering the 10,413 accounts for users owning 10 or more unique Stanley SKUs.
II. Defining the “Super Collector” & The Hydration Gap
- Super Collector Threshold: Using the Cupboard app’s Global Leaderboard, the “Top 5%” (Top 500) was isolated. The minimum entry requirement for this tier was found to be 90 items.
- Brand Intensity Comparison:
- Stanley: 500 users out of 10,413 total own 90+ items (approx. 1 in 20).
- Owala: 38 users out of 2,387 total own 90+ items (approx. 1 in 63).
- Functional Baseline: Comparative ownership metrics (4 bottles per person) were derived from the Evervessel 2024 drinkware ownership study.
III. Financial Modeling
- Weighted Mean Price: To determine the cost of a “Standard Collection”, we used a SKU-weighted mean MSRP to reflect catalog composition.
- Formula: (Sum of [MSRP x SKU Count]) / (Total SKUs)
- Resulting Prices: Stanley ($38.85), BruMate ($35.78), Owala ($33.18), HydroJug ($30.06).
- Collection Valuation: The “Super Collector” average portfolio ($6,155) was calculated by multiplying the Top 500 average inventory (158 units) by the Stanley weighted mean price ($38.85).
- Secondary Market Analysis: Based on 2,003 unique “Sold” listings on eBay (Nov 2025 – Jan 2026). Boolean search strings (e.g., “(“stanley” “post” “malone” “40”)”) were used to isolate specific collaborations in “New” condition.
- Opportunity Cost (Sentiment Tax): Modeled using a 20-year horizon (2026-2046) with a principal of $6,155 and a 10% compound annual growth rate (CAGR), reflecting the historical S&P 500 average.
- Formula: A = P(1 + r)^t
- Sentiment Tax: The difference between the projected investment value ($41,408) and the static asset value ($6,155).
IV. Physical & Resource Modeling
- Spatial Analysis: Footprint calculated using the 3.93-inch diameter of a 40 oz Quencher (approx. 12.13 sq inches per bottle). The total footprint for 158 bottles includes a 15% buffer for staggered shelf placement, totaling 17 square feet.
- Manhattan Rent Index: Applied the January 2026 Manhattan average rent per square foot ($8.21) to the collection’s footprint to derive the monthly “Rent Tax” ($139). Average rental pricing and square footage data for Manhattan, NY (Jan 2026) was sourced from RentCafe Market Trends (source).
- Weight Calculation: Based on the dry unit weight of a 40 oz Stanley Quencher (approx. 1.4 lbs / 0.63 kg).
- 158 units x 1.4 lbs = 221.2 lbs.
- Water Maintenance: Based on a standard maintenance rinse (1 gallon per bottle) utilizing a standard faucet flow rate of 2.2 gallons per minute (gpm).
V. Environmental Impact & Carbon Equivalency
- Steel Production: We utilized a global average emissions factor of 6.15 kg CO2e per 1 kg of stainless steel (Source: CarbonCloud).
- Unit Specification: This study focuses exclusively on the 40 oz Stanley Quencher (mass of 0.63 kg).
- Per-Unit Calculation: 0.63 kg x 6.15 kg CO2e = 3.87 kg CO2e per Quencher.
- Collection Impact: The average Super Collection (158 units) generates 611.46 kg CO2e.
- Single-Use Baseline: 500 ml PET plastic bottle emissions are modeled at 0.082 kg CO2e per bottle (Source: ResearchGate).
- Displacement Ratio (Volume-Adjusted): To account for the large capacity of the 40 oz (1,182 ml) Quencher, each full refill is calculated as displacing two (2) standard 500 ml PET bottles.
- Carbon Offset per Refill: 2 bottles x 0.082 kg = 0.164 kg CO2e saved per 40 oz refill.
- Break-Even Point: Calculated based on a realistic daily usage habit of one (1) full 40 oz refill per day.
- Total Refills Required: 611.46 kg / 0.164 kg offset = 3,728 refills.
- Time to Neutrality: 3,728 refills / 365 days = 10.2 years.
- Equivalency Formula: Total Collection Debt (611.46 kg) / Per-Bottle Emissions (0.082 kg) = 7,457 single-use plastic bottles.
- Vehicle Emissions Equivalency: To contextualize aggregate emissions, we use the U.S. Environmental Protection Agency benchmark that a typical passenger vehicle emits 4.6 metric tons (4,600 kg) of CO₂ per year, based on approximately 11,500 miles driven annually at 22 mpg (Source: United States Environmental Protection Agency).
- Coal Emissions Equivalency: To further contextualize the carbon impact, the total collection emissions are equivalent to burning ~650 pounds of bituminous coal, assuming each pound emits approximately 2.07 lb (0.94 kg) of CO₂ (Source: United States Environmental Protection Agency).
Methodological Limitations
1. Self-Selection Bias
Users of the Cupboard app are inherently “enthusiasts.” Therefore, the 53% conversion rate and Top 5% metrics reflect the active collector ecosystem rather than the general American public.
2. Geographic Specificity
The “Rent Tax” uses Manhattan real estate data. While mathematically accurate for urban centers, the physical burden is less financially impactful in regions with lower costs per square foot (e.g., rural areas with basement storage).
3. “Grey Market” Exclusions
Resale analysis focused on eBay “Sold” listings. This may exclude high-value private trades occurring in Discord “cook groups” or Facebook BST (Buy/Sell/Trade) groups, where profit margins may differ from public marketplaces.
4. Carbon Life-Cycle Constraints
The 3.87 kg CO2e per unit is a conservative estimate. It accounts for raw material production but excludes the carbon footprint of trans-pacific shipping, individual packaging, and last-mile delivery.

Jeremiah Kowalski
Jeremiah Kowalski is a drinkware product researcher who has personally tested 50+ reusable water bottles, tumblers, mugs, and filtration systems from leading brands. He focuses on real-world performance, durability, and safety to help readers choose drinkware that actually fits their daily hydration needs.